

Understanding Ethereum Trading in India
Explore Ethereum trading in India with this practical guide 📈. Learn trading methods, risk tips, Indian regulations, and useful tools to boost your crypto game.
Edited By
William Harris
Bitcoin trading relies heavily on candlestick charts to understand price movements within specific time frames. Among these, the daily candle represents one 24-hour trading period. The daily candle close time marks the point when that period ends and a new one begins, making it crucial for traders analysing trends and making decisions.
In India, knowing the exact close time of Bitcoin's daily candle is essential because Bitcoin trades on global exchanges operating mostly in Coordinated Universal Time (UTC) or in US time zones like Eastern Standard Time (EST). This creates a gap between Indian Standard Time (IST) and the candle close time displayed on these charts.

The Bitcoin daily candle close usually happens at 00:00 UTC, which translates to 5:30 am IST. This means, from an Indian trader’s perspective, the daily Bitcoin candle completes early morning each day.
Understanding this timing matters because:
Trading strategies depend on accurate daily closes. For example, many Indian investors plan their moves after the daily candle confirms a new trend or reversal.
Price alerts and market reports in India align with IST but reflect global candle timings. Mismatch in timing may cause confusion unless corrected for.
Intraday traders watching daily charts may miss key signals if they track candles on IST alone.
To adapt, Indian traders should:
Note the 5:30 am IST daily candle close and watch for price actions around this time.
Use charting platforms that allow custom time zone settings or explicitly show UTC close times.
Align their decision-making schedule to include this candle close rather than purely Indian market hours.
In practical terms, this understanding helps Indian traders read global Bitcoin price trends more accurately and harmonise their trading routines with worldwide markets. It also prevents mistakes arising from assuming daily charts close at midnight IST, which they do not.
This article helps Indian investors, analysts, and brokers to correctly interpret Bitcoin daily candle charts and better time their entries and exits in the market.
A Bitcoin daily candle summarises price movement over a 24-hour period on a candlestick chart. Traders rely on daily candles to capture the open, high, low, and close prices within this full day. Understanding these elements helps decode market behaviour and make informed decisions.
Each candle covers four prices: open, high, low, and close. The open price marks where trading started that day, while the close price marks the final transaction before the daily candle ends. High and low prices show the price range during the day. For example, if Bitcoin opens at ₹28 lakh, reaches a high of ₹30 lakh, dips to ₹27 lakh, and closes at ₹29 lakh, traders get a snapshot of price fluctuations and market volatility.
Daily candles represent continuous 24-hour trading cycles, unlike stocks that trade during fixed hours. Bitcoin trades globally on various platforms round the clock, making the daily candle an essential tool to understand full-day price movements. This continuity captures the full picture, especially for Indian traders syncing activities as per Indian Standard Time (IST).
The closing price of a daily candle often reflects market consensus for that day. Price closed near the day’s high implies buying strength; closing near the low suggests selling pressure. For instance, if Bitcoin’s daily candle closes above ₹29 lakh consistently, it can indicate bullish sentiment among traders.
Closing time governs when the daily candle forms. Since Bitcoin markets operate 24/7 globally, knowing the exact close time aligns trading strategies. Indian traders need to track the candle close in IST to plan entries, exits, or stop-loss orders effectively. Mistiming this can lead to misreading price signals or entering trades prematurely.
The daily candle close acts like a daily market report card—it sums up all trading action of the day and shapes next-day expectations.
In sum, the daily candle’s open, high, low, and close prices provide a concise market overview. The closing time, especially, influences how this data is interpreted by Indian traders wanting to sync their strategies with global Bitcoin price rhythms.
Understanding how time zones affect Bitcoin's daily candle close time is vital for Indian traders. The cryptocurrency market operates globally, meaning its 24-hour cycles don’t align perfectly with Indian Standard Time (IST). This mismatch influences when daily candles close on charts, impacting trading decisions and analysis.
Bitcoin markets use Coordinated Universal Time (UTC) as the standard reference for daily candle close times. UTC serves as the baseline time across all global exchanges since Bitcoin trades continuously without a centralised market close. Using UTC allows consistency in charting and helps traders around the world stay on the same page.
For Indian traders, knowing that daily candles close at midnight UTC means they must adjust this to their local time. Without this conversion, interpreting charts and timing trades becomes confusing and prone to errors.
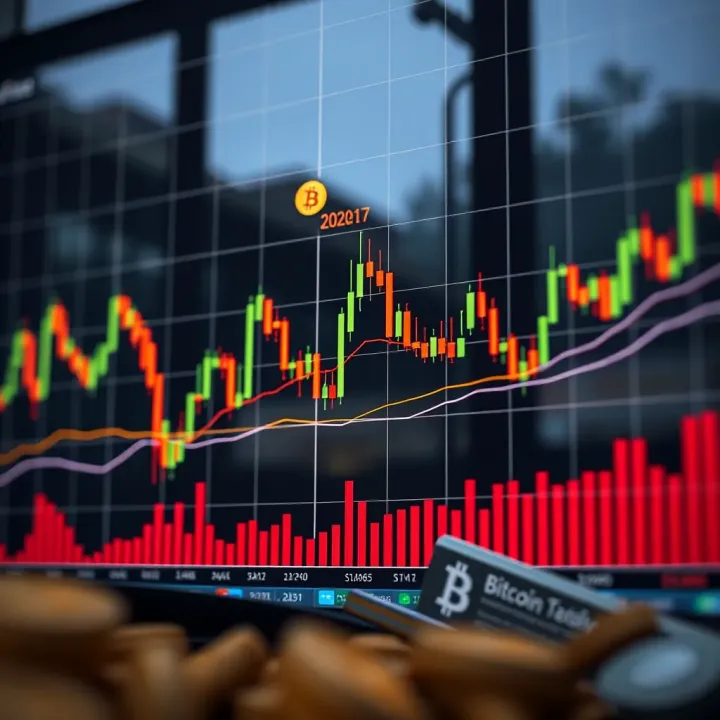
Most cryptocurrency exchanges run 24/7, but their candle close timings are usually fixed to UTC midnight or its multiples (such as 4-hour or 1-hour candles). Platform differences exist though; some might show candle close times adjusted to the user’s local time zone, while others stick strictly to UTC.
For example, Binance and Coinbase primarily use UTC times for candle closes, while Indian exchanges like WazirX might offer real-time data but still reference UTC-based candle closes. Traders should always check the default time zone settings to avoid misreading daily trends.
India is ahead of UTC by 5 hours 30 minutes (IST = UTC +5:30). This offset means the Bitcoin daily candle closing at 12 midnight UTC actually occurs at 5:30 am IST the next calendar day.
Practically, if an Indian trader checks the daily chart at midnight IST, the candle will still be open for another 5.5 hours. This can cause confusion about which day’s price movement is reflected in the candle unless the time zone difference is kept in mind.
To put this in perspective, a daily candle that closes at 12:00 am UTC on 5 March will close at 5:30 am IST on 5 March. So, trading activity from 5:30 am IST on 5 March ties to the same candle closing at midnight UTC.
For Indian traders, it’s best to synchronise their analysis and alerts with this 5:30 am IST close time. This way, daily trends and closing prices won't be mixed up with the Indian calendar day, avoiding mistakes in entry or exit decisions.
Keeping track of UTC timings and their conversion to IST helps Indian traders better time their trades and grasp market sentiment accurately.
Always confirm the chart’s time zone setting when analysing candles.
Remember the 5:30 hour offset while planning trade entries based on daily closes.
Use charting tools that offer time zone adjustments for seamless tracking.
Understanding these time zone details bridges the gap between global Bitcoin markets and Indian trading schedules, supporting more informed and timely crypto decisions.
Tracking Bitcoin daily candle close times on Indian trading platforms is essential for investors who want to align their trading strategies with global market behaviour. Since the daily close impacts price analysis and decision-making, knowing when exactly the candle closes on your trading platform helps set accurate entry and exit points.
WazirX, CoinDCX, and CoinSwitch Kuber are among the leading crypto exchanges in India, each offering candlestick charts for Bitcoin and other cryptocurrencies. These platforms usually default to UTC for their daily candle closes but display timings in Indian Standard Time (IST) for user convenience. For example, WazirX shows 24-hour candle intervals that correspond to UTC day closes converted to IST, while CoinDCX lets users toggle chart time zones in some cases.
Checking candle close times on these platforms typically means verifying the chart's time zone settings or referring to their support documentation. WazirX users, for instance, can confirm that a daily candle closes at 5:30 am IST, which matches the 00:00 UTC close. Indian traders should cross-check these details since candle closing times affect how price trends appear, especially near market open and close hours.
Platforms like TradingView offer more flexibility by allowing traders to select their preferred time zones, including IST. Indian investors who use TradingView can set their charts to display candles closing according to Indian time, which makes spotting daily closes more intuitive. Besides TradingView, other global chart services that support multiple time zones enable users to customise chart views matching their local timing.
Setting time zones and alerts for daily close on these tools helps traders stay updated without manual conversions between UTC and IST. Alerts set for candle closure times notify when a daily candle completes, a critical point for strategies relying on daily candle patterns. For instance, an alert at 5:30 am IST prompts traders that the Bitcoin daily candle has closed in terms of global market timing, allowing timely decisions.
Keeping candle close times accurate on your charts avoids confusion and helps track Bitcoin price movements precisely in sync with global markets. Indian traders gain an edge by matching their local time settings with international trade hours.
In summary, using popular Indian exchanges alongside global charting tools with Indian time zone settings supports clearer analysis and better-aligned trading strategies.
Understanding Bitcoin's daily candle close time has practical benefits for Indian traders and investors. Knowing when the daily candle closes helps in syncing trading strategies with global market movements. Since Bitcoin operates 24/7, the end of each daily candle essentially marks the completion of a trading day. For Indian participants, aligning with this timing means they can plan their trades with the same frame of reference as international traders, avoiding confusion arising from local time zone differences.
Planning entry and exit points around daily closes is a key tactic for effective trading. The daily close price is often considered the most reliable price point of the day, reflecting market consensus. For instance, an Indian trader who sees a bullish candle closing near 5:30 am IST (which usually marks the UTC daily close) can interpret strong buying sentiment. Planning to enter or exit positions close to this daily close can help capture momentum or avoid late-day volatility that sometimes follows after the candle closes.
Risk management through understanding close times further sharpens a trader’s approach. Imagine a trader who sets stop-loss orders without considering the candle close time difference; sudden price swings right before or after the UTC close can trigger unwanted stops. By factoring in the exact daily closing time (5:30 am IST), the trader avoids premature exits due to time zone mismatches. This prepares investors for potential overnight price gaps or volatility spikes that happen after India’s market hours, helping them manage exposure better.
How mixing up UTC and IST affects trades can lead to mistimed decisions. Since India is ahead of UTC by 5 hours 30 minutes, traders who forget to adjust for this may act hours too early or too late. For example, placing an order based on UTC closing candle data without converting might cause missed opportunities or unwanted entry points. Such errors can quickly eat into profits, especially in a market as volatile as Bitcoin.
Tips for confirming accurate timing before trading include double-checking the candle closing time shown on charts and syncing it with IST. Indian traders can use tools like TradingView, which allow time zone configuration. Setting alerts near the 5:30 am IST mark helps ensure actions align with the global daily close. It's also advisable to cross-verify timing on multiple platforms to avoid discrepancies caused by platform default settings.
Staying clear of timing confusion not only sharpens trading decisions but also minimises preventable losses. Align your trading routine with the UTC-based daily candle close at 5:30 am IST to trade smarter in Bitcoin markets.
By paying close attention to Bitcoin's daily candle close time, Indian traders can better plan their market moves and risk controls, improving overall trading outcomes in the volatile crypto space.
Accurately tracking the Bitcoin daily candle close time is essential for Indian traders who want to time their trades effectively and avoid surprises. Since this close time follows Coordinated Universal Time (UTC), understanding the time difference and adjusting tools accordingly ensures you don't miss critical market signals. This section highlights the key points to remember and shares practical advice to help Indian crypto enthusiasts align their trading with global market rhythms.
The daily candle for Bitcoin resets based on UTC, which means the 24-hour trading period ends at 00:00 UTC. This closing price often sets the tone for market sentiment and influences subsequent trading sessions. For Indian traders, knowing this helps interpret charts correctly. For instance, a daily close candle marked at 00:00 UTC on 6 March actually reflects activity ending at 5:30 am Indian Standard Time (IST) on 6 March.
Since Bitcoin trades 24/7 across multiple exchanges worldwide, the UTC close standardises charting irrespective of local market hours. Without understanding this UTC basis, an Indian trader might misjudge trend shifts, leading to poor entry or exit decisions.
Indian Standard Time (IST) runs 5 hours 30 minutes ahead of UTC. Practically, this means that when it is midnight UTC, it is already 5:30 am IST the next day. Thus, the Bitcoin daily candle that closes at 00:00 UTC closes well into the next calendar day in India.
For example, the candle close for 6 March at 00:00 UTC effectively happens at 5:30 am IST on the same day. Traders active during Indian market hours need to consider this offset to correctly align their timing with global price moves.
Most Indian crypto platforms show candlestick charts based on UTC, but some let you switch to IST. Setting your charting tool to IST helps you see the candle closes in your local time, simplifying decision-making. Alerts should also reflect your time zone to notify you precisely when the daily candle closes.
If your platform does not support time zone changes, manually calculate the 5.5-hour difference to avoid confusion. For example, a buy signal generated at the daily close on a global chart at midnight UTC is 5:30 am IST — missing this shift might cause delays in responding to trading signals.
Trading services like TradingView allow users to set their preferred time zone, including IST. Indian traders benefit from this feature by viewing price movements and candle closes aligned with their daily schedule, eliminating guesswork.
This practical step reduces errors tied to timezone misunderstandings and helps you plan trades during your active hours. Exchanges like WazirX and CoinDCX often stick to UTC, so combining them with global charting tools that support IST presents a balanced approach.
Understanding when the daily candle closes lets you plan trade entries, exits, and risk management more effectively. Many trading strategies rely on daily close prices as confirmation points, so syncing your plans with these timings enhances precision.
For instance, if an Indian trader knows the Bitcoin daily candle closes at 5:30 am IST, they can monitor price action just before and after this time for better insight. This way, decisions are not based on incomplete data from an unclosed candle.
Even though Bitcoin trades 24/7, volumes and volatility vary globally. Certain times, like during US or European market sessions, bring higher activity and clearer daily candle closes. Indian traders should watch these windows closely.
Keeping track of global finance and crypto news during these hours helps in understanding why prices move suddenly and allows timely reactions. It also prevents surprises caused by trading outside the most liquid periods.
Practical awareness of Bitcoin daily candle close times linked with UTC and adjusted to IST can markedly improve trading outcomes for Indian investors. Using the right platforms and syncing your schedule with global cycles keeps you ahead in the crypto game.
Explore Ethereum trading in India with this practical guide 📈. Learn trading methods, risk tips, Indian regulations, and useful tools to boost your crypto game.
Discover top demo trading apps in India 📱, learn key features and how to use them effectively to practise trading strategies risk-free before real investing 💹.

Explore Quotex trading in India 🇮🇳 with this detailed guide 📊 covering platform setup, asset types, risk management, strategies, and regulatory tips ✅
Explore Quotex options trading in India 🇮🇳 with our guide covering key features, strategies, risks, and practical tips to help you trade smarter and safer 🔍📈.
Based on 12 reviews