
Rayner Teo Net Worth: Detailed Financial Insights
Explore Rayner Teo's net worth 💰, career as a trader & educator 📈, income sources 💼, investment strategies 📊, & trading tips tailored for India 🇮🇳 investors.
Edited By
Sophie Lewis
The DAX index serves as Germany’s prime stock market benchmark, representing 40 of the largest and most actively traded companies on the Frankfurt Stock Exchange. Launched on 1 July 1988, the DAX tracks the performance of blue-chip firms, providing a clear view of Germany’s economic health. Its roots go deeper, however, stretching back to earlier German stock indices used to gauge market movements.
Investors and analysts closely follow the DAX because it reflects not only local but also broader European market trends. Unlike many indices, the DAX is a total return index, meaning it factors in dividends paid out by the component companies, giving a more comprehensive picture of returns.
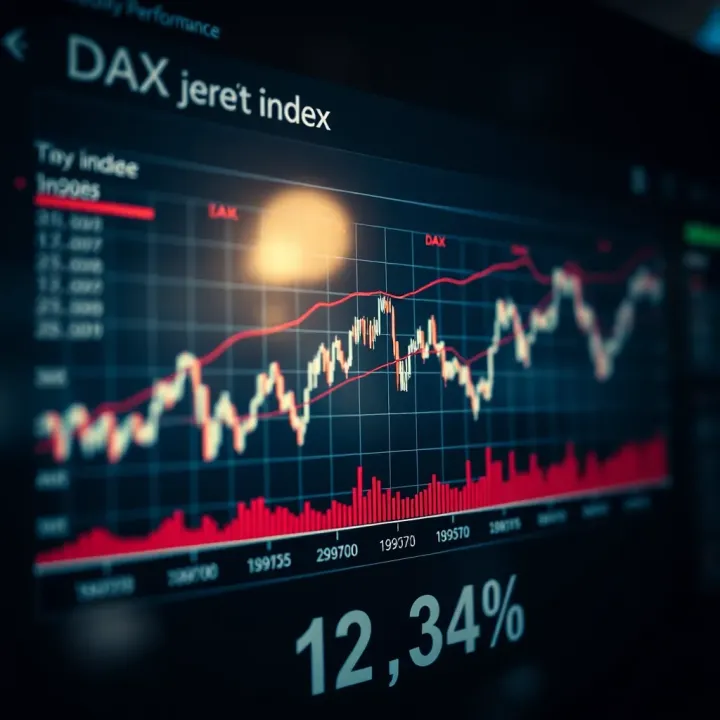
Historical data on the DAX offers valuable insights into market cycles, volatility, and investor behaviour. For example, the global financial crisis of 2008 caused the DAX to plunge by nearly 40% within a single year, while recovering steadily over the following decade. Similarly, reactions to the Eurozone debt crisis, the US-China trade tensions, and more recently, the COVID-19 pandemic show distinct patterns in the index's movement.
Reliable data for the DAX’s history comes from official market sources like the Frankfurt Stock Exchange and Deutsche Börse. These institutions provide daily opening, closing, high, and low values, along with trading volumes. Advanced analysis uses this data for charting long-term trends, calculating moving averages, and modelling market responses during turbulent periods.
Understanding the historical movement of the DAX helps traders and investors identify potential support and resistance levels, aiding more informed decision-making.
For practical applications, advisors often compare the DAX’s performance with global indices such as the S&P 500 or Nikkei 225 to analyse international market correlations. Moreover, portfolio managers can assess risk exposure against the DAX's volatility history to fine-tune asset allocation.
Grasping historical data of the DAX index is essential not only to understand past behaviour but also to anticipate future market possibilities. This section sets the stage for deeper examination of its key milestones and event-driven shifts in the charts that follow.
Understanding the DAX index is essential for traders, analysts, and investors looking to gauge Germany’s economic health and European market sentiment. The DAX stands as one of the foremost benchmarks for the German stock market, reflecting the performance of leading companies traded on the Frankfurt Stock Exchange. Grasping its structure and calculation method helps market participants interpret movements accurately and make informed decisions based on historical and real-time data.
The DAX (Deutscher Aktienindex) represents the top 40 blue-chip companies listed on the Frankfurt Stock Exchange. It is a performance index, meaning it factors in dividends paid by its components, unlike a simple price index. This approach provides a clearer picture of total shareholder returns. For example, major firms like Siemens, Volkswagen, and Deutsche Bank significantly contribute to the DAX’s overall movement. Tracking the DAX gives insights into the German economy, as these companies cover key sectors like automotive, finance, and industrial manufacturing.
The DAX’s performance often influences global market sentiment due to Germany’s status as Europe's largest economy. Investors and advisors frequently watch the index to assess risk appetite and economic trends in the Eurozone. Its responsiveness to domestic and international events means historical DAX data serves as a useful tool to study market reactions.
The DAX index includes the 40 largest companies by free-float market capitalisation and order book volume. Companies must meet criteria around liquidity and listing duration to qualify. Unlike some indices that simply average share prices, the DAX is weighted by market capitalisation, adjusting for free-float shares. This approach ensures larger companies have proportionate influence on the index’s value.
Calculation occurs every second during trading hours, reflecting live market movements. The index base value was set at 1,000 points on 30 December 1987, providing a consistent benchmark.
The formula incorporates total returns by reinvesting dividends, which makes it attractive for assessing long-term performance. This is particularly helpful for investors comparing the DAX with other international indices like the FTSE 100 or BSE Sensex.
Because the DAX accounts for dividend reinvestments and adjusts for market capitalisation, it offers a more comprehensive reflection of market health compared to simple price indices.
In sum, knowing what the DAX is and how it is composed plus calculated sets the foundation for exploring its historical data. Such knowledge allows traders and investors to better interpret the context behind market moves and historical trends.
Understanding the sources and types of DAX historical data is essential for anyone analysing this German stock market index. The quality and format of historical data can significantly affect investment decisions and market research. Reliable data sources provide accurate index values, volumes, and corporate action details necessary for traders, analysts, and brokers to make informed calls.
The Deutsche Börse Group, which owns and operates the DAX index, is the primary official source of accurate and timely historical data. Their platform offers detailed daily closing prices, adjusted for dividends and splits, alongside other market metrics. Financial information providers like Bloomberg and Reuters also source their DAX data from Deutsche Börse but add analysis tools useful for deeper insights.
For traders in India and elsewhere, platforms such as NSE India offer access to international indices, including DAX, through their global market sections. Indian brokers often integrate such feeds into their trading terminals, giving clients real-time and historical snapshots. Platforms like Investing.com and TradingView provide user-friendly interfaces where historical DAX data can be downloaded or charted with custom time frames.
DAX historical data is available in multiple frequencies to suit different types of market participants:
Daily Data: The most common frequency, daily data includes open, high, low, close, and volume for each trading day. It benefits swing traders and long-term investors who track day-to-day market shifts.
Intraday Data: For intraday or high-frequency trading, data might be available in one-minute or five-minute intervals, detailing price movements throughout the trading day. Some platforms provide tick data, although this is less commonly required outside professional trading firms.
Monthly and Yearly Data: Investors focusing on long-term trends rely on aggregated monthly or yearly data, which smooths out day-to-day volatility and highlights underlying patterns.
Data usually comes in CSV or Excel formats, allowing easy import into analysis software or customised spreadsheets. Some platforms offer APIs (Application Programming Interfaces) that enable automated data retrieval, which is a boon for analysts running algorithmic models.
In summary, the convenience of acquiring DAX historical data today allows several ways to tailor the raw figures into actionable insights. Selecting the right source and data format matches specific needs, whether you are charting trends in Mumbai or running a strategy desk in Bengaluru.
Understanding the major historical trends and milestones of the DAX index helps investors grasp how the market has evolved over time, especially in response to economic shifts and crises. This perspective offers valuable context when analysing current performance or forecasting future behaviour. The timeline of DAX growth and setbacks reflects broader economic cycles, investor sentiment, and external shocks, which traders and analysts must keep in mind.
The DAX index was introduced in 1988 with a base value of 1,000 points, symbolising Germany’s post-reunification economic potential. In its early years, it mainly tracked industrial giants such as Siemens, Bayer, and Volkswagen. During the 1990s, the German economy expanded rapidly amid European integration and globalisation, driving the DAX steadily upward. This growth phase was characterised by rising corporate earnings, foreign investment inflows, and technological advances across manufacturing and automotive sectors. For investors, this period demonstrated how macroeconomic strength and structural reforms directly boosted index performance.
At the turn of the millennium, the bursting of the dot-com bubble impacted the DAX notably. While Germany's index was less tech-heavy than the NASDAQ, the ripple effects led to a sharp correction between 2000 and 2003. Companies in sectors like telecommunications and new media bore the brunt. This episode teaches investors how technology sector bubbles elsewhere can influence European markets indirectly, signalling the importance of diversification when relying on historical trends.
The 2008 crisis triggered a severe downturn for the DAX, falling roughly 50% from its 2007 peak. Rooted in the US subprime mortgage collapse, the crisis caused a liquidity crunch that spread globally. German exporters and banks faced declining demand and credit issues. Yet, the recovery from 2009 onward showed the resilience of the DAX, backed by stimulus measures and corporate restructuring. Traders looking at historical charts find this period useful to understand how systemic crises affect even strong, export-driven economies.
Between 2010 and 2012, the Eurozone debt crisis weighed heavily on the DAX as fears over Greece, Spain, and Italy's fiscal stability increased market volatility. Although Germany's economic fundamentals remained robust, uncertainty about the euro and policy responses led to several sharp swings. For investors, the lesson is clear: political and sovereign risks in interconnected economies influence even top-performing indices and require close monitoring.
The 2020 COVID-19 outbreak caused an abrupt plunge in the DAX as lockdowns and supply chain disruptions hit companies hard. It dropped over 35% within weeks but bounced back relatively quickly due to government support, low-interest rates, and vaccine rollouts. The pandemic period highlights how unexpected global health crises create fast shifts in market sentiment and valuation, reinforcing the need to adapt trading strategies rapidly.
Since the pandemic shock, the DAX has shown resilience by steadily recovering and reaching new highs by 2023. The index benefited from economic reopening, rising exports to Asia, and advancements in green technologies embraced by many German firms. Investors tracking recent recovery patterns can spot how sectors like renewable energy and tech have gained prominence, signalling shifts in market leadership. Keeping an eye on such evolving milestones helps investors position themselves strategically for long-term trends.
Historical milestones of the DAX offer a roadmap of market behaviour through ups and downs, guiding investors in improving timing, risk management, and portfolio diversification.
In summary, the DAX’s major trends and milestones reflect a complex interplay of economic growth, crisis shocks, and recovery phases. Traders and advisors who study these patterns gain a stronger foundation for interpreting current market signals and anticipating future moves.
Understanding the past movements of the DAX index offers traders and investors practical guidance for their decision-making. Historical data reveals patterns in how the index reacts to economic events, policy changes, and global trends. Using this data effectively helps identify potential entry and exit points and manage risks better.
Technical analysis relies heavily on past price movements and volumes to forecast future trends. For the DAX, this involves examining charts, moving averages, and indicators like Relative Strength Index (RSI) and Bollinger Bands based on historical daily or hourly data. For example, during periods of volatility around the 2008 financial crisis, traders who monitored support and resistance levels could better time their investments. Incorporating historical volume data alongside price fluctuations provides further clues about market sentiment.
Using DAX historical data for technical analysis also includes backtesting trading strategies on previous data points. This helps traders assess the potential effectiveness of strategies before risking capital. A practical case is applying a moving average crossover strategy to DAX data from 2010-2020, which may have helped capture recovery phases post the Eurozone debt crisis.
Long-term investors benefit from spotting sustained uptrends, downtrends, and market cycles using historical data. The DAX has shown resilience with ups and downs over decades, reflecting Germany's economic health. Studying multi-year charts reveals secular trends and cyclical phases coinciding with political changes or global crises.
For instance, observing the DAX’s performance before and after events like the COVID-19 pandemic helps understand recovery speed and long-term growth trends. Historical data also assists in recognising cycles such as bull and bear phases, which typically span years. This aids in strategic asset allocation, balancing equity exposure in line with expected market cycles.
Using DAX historical data thoughtfully can sharpen both short-term tactics and long-term investment planning, making it an indispensable resource for market participants.
To sum up, DAX historical data is more than just records of past prices. It provides actionable insights through technical analysis and long-term trend identification that support informed investment choices and risk management.
Interpreting historical data for the DAX index requires caution due to several intrinsic limitations that can affect accuracy and applicability. Understanding these limitations helps investors and analysts avoid misjudgements when using past data to predict future trends. For example, raw historical prices might not reflect corporate actions like dividends or stock splits unless adjusted properly, which can distort performance evaluations.
DAX historical data undergoes periodic adjustments to account for corporate events such as stock splits, dividends, or changes in the index composition. These adjustments ensure comparability over time but can confuse users unfamiliar with their impact. For instance, if a company in the DAX issues a stock split, unadjusted historical prices would show a sudden drop, misleading analysts about the index’s real performance.
Moreover, data revisions sometimes occur when data providers correct errors or update methodologies. Such revisions may subtly alter previously published data. For example, switching calculation methods or updating the basket of stocks in the index can change historical data retrospectively, affecting backtesting results for trading strategies. Traders and advisors should verify the source and version of the data they use and clarify if adjustments are included.
External economic and geopolitical factors strongly influence the DAX’s historical performance, making it essential to contextualise data correctly. Events like the Global Financial Crisis of 2008 or the Eurozone Debt Crisis caused drastic shifts in the index, not because of internal changes but due to wider market sentiments and economic disruptions.
Similarly, regulatory changes or technological disruptions can affect index behaviour. For example, the introduction of high-frequency trading or shifts in monetary policy by the European Central Bank often lead to volatility spikes. Ignoring these external elements risks oversimplifying the index's history and drawing wrong conclusions.
Remember: Historical data is a tool, not a crystal ball. It reflects past conditions influenced by factors sometimes absent in current or future environments.
When working with DAX historical data, investors and analysts should always account for these limitations and maintain a holistic view, integrating macroeconomic contexts alongside raw data. This approach ensures better-informed decisions and helps avoid pitfalls caused by incomplete or misunderstood historical records.
Explore Rayner Teo's net worth 💰, career as a trader & educator 📈, income sources 💼, investment strategies 📊, & trading tips tailored for India 🇮🇳 investors.

Explore Quotex India’s platform with tips on safe trading, features, risks, and investment options to help Indian traders make smart choices 📈💡
Explore QX Broker's features, trading platforms, account types, fees, and support to make informed forex & CFD trading decisions in India 🇮🇳📊💼
Explore Reliance Industries' share price outlook till 2030 📈, key growth drivers, risks, and how market trends could shape its future in India's economy 🇮🇳.
Based on 7 reviews