
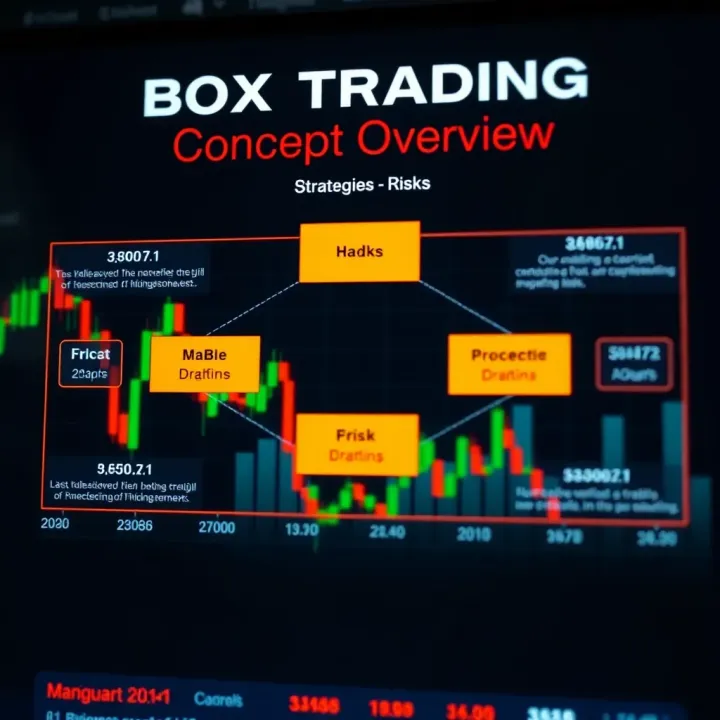
Understanding Box Trading Strategies and Risks
Explore how box trading works in financial markets, its pros & cons, legal aspects, and practical use by traders. Know what investors must consider before using this method 💹
Edited By
Isabella Reid
The box trading strategy offers a straightforward way to understand price movements within a range. It helps traders identify zones where prices consolidate before making a break for higher highs or deeper lows. In the Indian markets, where volatility can spike around economic events or corporate results, this strategy provides clarity on when to expect a breakout or reversal.
At its core, the strategy defines a "box" — a horizontal range formed by support and resistance levels that confine price action for a period. When prices hover inside this box, traders watch for signs of buildup, signalling potential energy for the next move.
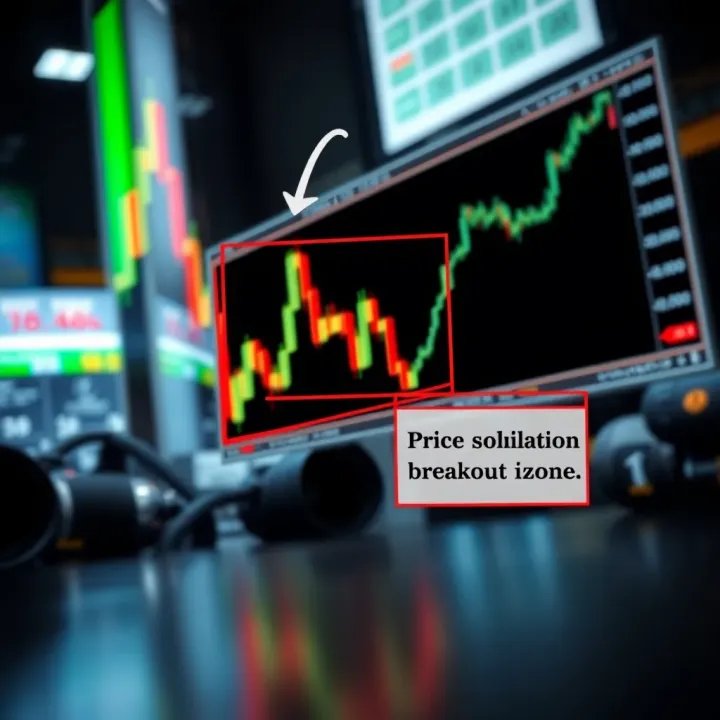
For example, consider a stock in the Nifty 50 index that trades between ₹1,200 and ₹1,250 for several days. This price band forms the box boundary. Once the stock breaks above ₹1,250 with good volume, it may indicate a bullish breakout opportunity. Conversely, dropping below ₹1,200 could signal a bearish reversal.
Recognising the box pattern requires careful chart analysis. Traders need to mark clear horizontal lines where prices repeatedly touch but do not breach. The more times price tests these levels, the stronger the box is considered. This is crucial because false breakouts happen often, and strong support or resistance reduces that risk.
The box trading strategy hinges on accurately spotting consolidation zones to anticipate the next meaningful price move. This technique suits various timeframes — from intraday sessions on platforms like Zerodha Kite to daily charts for positional trades.
Practical use of this strategy demands discipline in placing stop-loss orders just outside the box boundaries. This helps manage risk effectively if the breakout fails. Also, combining box patterns with tools like Relative Strength Index (RSI) or volume analysis boosts trade confirmation.
Indian traders benefit from this strategy by aligning their entries near the box limits and setting realistic profit targets once the breakout happens. The approach avoids chasing volatile moves blindly and promotes structured decision-making.
In summary, mastering the box trading strategy establishes a solid base for navigating price consolidation and breakout plays, offering a clear edge in dynamic Indian stock or commodity markets.
The box trading strategy focuses on identifying price consolidation zones represented by a rectangular "box" on price charts. Traders watch these zones closely since prices tend to bounce within this range until a strong move breaks out either upwards or downwards. This approach helps traders plan entries and exits more precisely during volatile markets.
In Indian markets, where sectors often see periods of sideways movement, recognising such boxes can prevent premature trades and missed opportunities. For example, a stock listed on NSE may consolidate between ₹1,200 and ₹1,300 for weeks, signalling indecision. A breakout beyond these limits often leads to strong directional moves that traders want to catch early.
Box patterns appear when price action moves within two relatively parallel levels, forming a clear horizontal or slightly slanted rectangle on charts. This range highlights equilibrium between buyers and sellers, where neither side dominates. The box can appear on daily, weekly, or intraday charts, but its clarity improves with timeframes.
Drawing boxes around these ranges allows traders to visualise support (lower boundary) and resistance (upper boundary) levels clearly. This visual aid simplifies the decision-making process as traders prepare for breakouts or reversals from the box.
Prices consolidate due to market uncertainty or a balance of supply and demand. After a strong trend, market participants often pause, reassess, and trade within a range while awaiting fresh triggers like earnings, policy changes, or global cues.
This consolidation also reflects profit booking and new buyers entering cautiously. For instance, during monsoon-related seasonal slowdowns, commodity prices may trade sideways forming boxes until new demand patterns emerge.
Box patterns offer clear trading signals: a breakout above resistance suggests bullish momentum, while a drop below support indicates bearish moves. Traders can set targets based on the box's height, which estimates probable price movement post-breakout.
Knowing the box boundaries helps in placing stop-loss orders effectively, reducing downside risks. In volatile Indian markets, this aids in avoiding false breakouts, especially during festival seasons when liquidity and volatility can surge.
Horizontal boxes reflect price moving sideways between fixed support and resistance. This pattern is typical during market pauses or indecision, often lasting from days to weeks.
For example, a stock in the FMCG sector may trade steady between ₹400 and ₹425 for a month, signaling neither buyers nor sellers have the upper hand. Trading within these bounds involves buying near support and selling near resistance until a breakout occurs.
Sometimes boxes tilt slightly upwards or downwards, indicating gradual shifts in market sentiment. Ascending boxes show increasing lows, signalling buyer strength building gradually even if resistance remains.
Descending boxes mark lower highs and support, suggesting weakening demand and potential bearish breakout. These patterns require a more cautious approach, as breakouts might be less predictable than perfectly horizontal boxes.
The time span and size of a box affect the reliability of its signals. Longer consolidations on bigger timeframes usually indicate stronger build-up before significant moves.
Similarly, taller boxes (larger price ranges) often project larger breakouts in absolute terms. For example, a box spanning ₹50 in a stock trading at ₹500 suggests a probable move of ₹50 or more upon breakout, guiding target setting and risk management effectively.

Understanding these nuances in box patterns lets you spot trading setups with better confidence and manage risks smartly in Indian markets that often see cyclical consolidation phases.
Identifying box patterns on trading charts is a key step for traders looking to capitalise on periods of price consolidation. Box patterns indicate where prices mostly trade within a range, bounded by clear support and resistance levels. Recognising these zones helps traders plan better entries or exits, reducing the chance of whipsaws or false moves.
Support and resistance form the backbone of box patterns. Support is the lower boundary where price tends to find buying interest, preventing further decline. Resistance is the ceiling where selling pressure caps upward movement. When price bounces repeatedly between these two levels without breaking out, it creates a clear box or rectangle pattern. For example, if a stock on the NSE trades between ₹1,000 and ₹1,050 for several days, this range sets the box boundaries. Traders watching these levels can anticipate breakouts or reversals near these lines.
Examining candlestick formations inside the box offers clues about trader sentiment. Small-bodied candles with long wicks, like dojis or spinning tops, often appear during consolidation, reflecting indecision. If bullish formations such as hammer candlesticks arise near support, it signals potential price bounce. Conversely, bearish patterns near resistance warn of a possible drop. These signals help traders decide whether to expect the price to hold within the box or attempt a breakout.
Volume tends to reduce inside box patterns as trading activity declines during sideways movement. Lower volume suggests neither bulls nor bears dominate. However, a sudden volume spike often precedes breakouts or breakdowns. Watching volume changes alongside price movement inside the box adds confirmation. For instance, a volume surge on a breakout above resistance indicates strong buying interest validating the move.
Simple moving averages (SMA) and exponential moving averages (EMA) can align closely with box boundaries. For example, the 20-day SMA might coincide with the support level while the 50-day EMA aligns with resistance. Price staying within these moving average bands reinforces the presence of a box. Traders use this to time entries and exits accurately, as breaching moving averages suggests a directional change.
Relative Strength Index (RSI) and Stochastic Oscillators measure momentum and overbought/oversold conditions within the box. Typically, these oscillators fluctuate between 30 and 70 during consolidation. If RSI approaches oversold near support, it hints at a bounce; if overbought near resistance, a reversal might follow. Such clues confirm the indecisive nature of box trading and assist in spotting potential reversal points.
Indicators like On-Balance Volume (OBV) or Volume Weighted Average Price (VWAP) offer deeper insight into the strength of volume trends. Rising OBV during a breakout signals accumulation and validates the price move. Using these volume indicators alongside price helps Indian traders distinguish genuine breakouts from false ones, enabling better risk control.
Spotting box patterns relies on combining price action clues like support and resistance with volume and momentum indicators. This multi-layered approach empowers traders to enter and exit trades more confidently during consolidation phases.
Through focused observation of these chart features and indicators, traders in markets such as NSE, BSE, or commodities can effectively apply box trading strategies to sharpen their timing and improve outcomes.
Successfully trading box patterns hinges on correctly timing your entry and exit points. The box strategy identifies price consolidation zones where the market moves sideways within a defined range, creating clear support and resistance levels. Acting on breakouts and bounces within this range lets traders capture significant moves while managing risk effectively.
Trading the Breakout: Entry After Price Exits the Box
A key approach is to enter trades immediately after the price breaks out of the established box, either above resistance or below support. This breakout signals a likely continuation of momentum, offering an opportunity to ride fresh trends. For instance, if Infosys shares trade within ₹1,650–₹1,700 for a few days and then surge past ₹1,700 with volume, this breakout alerts traders to buy expecting further upside.
This strategy requires patience, waiting for confirmation before committing capital. A false breakout can trap traders, so checking volume spikes or other indicators alongside price movement helps validate the trade.
Trading the Bounce: Reversals Inside the Box
Sometimes, the price touches the box’s support or resistance but reverses direction without breaking out. Traders can exploit these bounces by entering positions that anticipate a move back towards the opposite boundary of the box. For example, in a commodity like crude oil priced between ₹4,200 and ₹4,400 per barrel, a drop to ₹4,200 followed by signs of strength may present a buying opportunity aiming for ₹4,400.
Though less aggressive than breakout trades, bounce strategies allow more controlled risk, as stop-losses can be tight just beyond box boundaries. However, it demands good timing and confidence to avoid getting caught if the box eventually breaks.
Setting Targets Based on Box Height
Targets for trades often come from the height of the box—the difference between its support and resistance levels. Once a breakout or bounce occurs, traders set price targets equal to this height, measured from the breakout point.
For example, if Reliance Industries stock is confined between ₹2,400 and ₹2,460, a breakout above ₹2,460 might signal a target near ₹2,520, which is ₹60 (box height) added to the breakout level. This measurable approach helps avoid guesswork and set realistic exit points.
Equity Trading on NSE and BSE
Indian equity traders often use box patterns to time entries during volatile phases. For instance, during the Diwali festive season, many stocks pause in a tight range before breaking out as market sentiments shift. Traders tracking Tata Motors or HDFC Bank on NSE can identify consolidation boxes on daily charts and plan trades around breakouts or bounces, considering Indian market volatility and volume patterns.
Commodity Trading Using Box Patterns
In commodities such as gold or crude oil, prices frequently move sideways within narrow ranges before trending strongly. Traders on MCX watch box formations closely to trade breakouts efficiently. A consolidation in gold prices between ₹48,000 and ₹49,000 per 10 grams might signal a breakout move when prices cross either level, which traders then use to enter or exit trades.
Currency Market Applications
The INR-USD and INR-EUR pairs also show box patterns, especially during geopolitical events or RBI policy announcements. Forex traders monitor these ranges on platforms like NSE’s currency derivatives segment. For example, if USD-INR fluctuates between ₹74.50 and ₹75.20 before breaking higher, traders can act on these signals, using box height to set targets or placing tight stop-losses during bounce trades.
Understanding the nuances of executing trades based on box strategy can sharpen your trading approach. It offers practical methods to capture momentum while managing risk effectively, particularly in dynamic Indian markets.
Managing risk is essential when applying the box trading strategy because the price often fluctuates within a confined range before breaking out. If you do not handle risks properly, losses could pile up quickly, especially when false breakouts or sudden reversals occur. By controlling your position size, using stop-loss orders, and adapting to market volatility, you can protect your capital and increase your chances of consistent profits.
Deciding how much to trade within a box setup depends on your total capital and risk tolerance. A practical approach is to risk only a small percentage of your trading capital—typically 1-2%—on any single position. For example, if you have ₹5 lakh, risking ₹5,000 to ₹10,000 per trade helps prevent large drawdowns that could hurt your overall portfolio.
Allocate capital based on the box’s size and volatility. If the box covers 2 points on the Nifty chart, a larger position might be sensible compared to a narrow box of 0.5 points. Always keep in mind that the profit potential and stop-loss distance come from the box’s height.
Stop-loss placement is equally vital. Putting stop-loss orders just outside the box boundaries limits potential losses when price moves against your position. If price breaks the box but reverses, the stop will protect you from a bigger hit. For instance, if the upper boundary of a box is at 11,000 on the Sensex, setting a stop-loss at 11,010 prevents excessive loss if a breakout is false.
Adjusting your position size according to volatility keeps risk particles balanced. When markets are choppy, reduce your size to withstand unexpected swings. Conversely, during stable phases, you can increase the position size slightly. Traders often track the Average True Range (ATR) indicator to measure volatility and tweak their trade volume accordingly.
False breakouts are a common trap in box trading when price briefly moves beyond the box but fails to sustain the trend. Signs include low volume on the breakout, lack of momentum, or quick price reversal within few candles. Recognising these helps you avoid jumping in too early.
Confirmation indicators such as increased volume, RSI (Relative Strength Index) moving above 50, or MACD (Moving Average Convergence Divergence) showing bullish crossover can validate genuine breakouts. Combining multiple indicators reduces the chance of being misled by fake moves.
It's wise to stay out of trades if a breakout lacks confirmation or if price lingers too long near box limits without a clear direction. Being patient and waiting for clear signals prevents unnecessary losses. Sometimes, no trade is a trade in itself.
Effective risk management in box trading isn’t just about protecting capital but also about maintaining mental discipline and avoiding impulsive decisions that stem from fear or greed.
In summary, managing risk with proper position sizing, stop-loss placement, adapting to volatility, and spotting false breakouts equips traders to trade boxes with more confidence and fewer surprises.
Using the right tools and platforms significantly improves the effectiveness of the box trading strategy. Traders benefit from accurate chart visualisation, quick drawing features, and timely alerts, which help spot consolidations and breakouts fast. Given the fast-moving nature of Indian markets, choosing platforms that offer these capabilities is essential for swift decision-making.
Many Indian traders rely on platforms like Zerodha Kite, Upstox Pro, and TradingView for charting needs. Zerodha Kite offers a clean interface with easy drawing tools, while TradingView is known for advanced charting and a wide array of community-driven scripts. Upstox Pro combines simple usability with powerful features. These platforms support Indian market data integration, which ensures up-to-date price movements for NSE, BSE, and commodity trading.
Manually drawing boxes involves marking clear support and resistance levels on price charts, highlighting consolidation zones. Most charting tools provide line and rectangle drawing options for this. On the other hand, platforms like TradingView offer automated box pattern detection through custom scripts. These auto-boxes reduce manual effort and avoid subjective errors, highlighting potential consolidation zones efficiently.
Alerts keep traders informed when price breaks out of the box range, a critical moment to act. Zerodha Kite and TradingView let users set price-specific alerts or trigger notifications based on script conditions. This way, you do not have to monitor charts constantly. Instead, you get a timely signal to enter or exit trades, which is especially handy during volatile trading sessions.
Custom scripts can simplify identifying box patterns by automatically signalling consolidation zones and breakout points. TradingView hosts a large library where users can select or modify scripts tailored for box trading. Zerodha Kite’s integration with Sensibull and in-built tools allow overlaying such scripts as well, helping traders get an edge with ready-to-use technical set-ups.
Volume analysis is crucial in box trading to distinguish between genuine and false breakouts. Tools often incorporate indicators like On-Balance Volume (OBV) or Volume Weighted Average Price (VWAP) to track buying or selling strength within the box. Momentum indicators like RSI (Relative Strength Index) and Stochastic oscillator help confirm whether price momentum supports the breakout direction.
Combining box patterns with other technical signals improves trade reliability. For example, pairing box breakouts with moving average crossovers or divergence in MACD (Moving Average Convergence Divergence) can validate entries. Platforms supporting multi-indicator layouts allow traders to overlay these signals, offering a more comprehensive view before acting.
Efficient use of charting platforms and indicators gives box trading method a sharper edge, making technical analysis timely, easier, and more actionable in India’s dynamic markets.
Explore how box trading works in financial markets, its pros & cons, legal aspects, and practical use by traders. Know what investors must consider before using this method 💹

📈 Learn to spot and trade range markets smartly! Understand key traits, tools, and strategies, plus how these differ from trending markets for savvy trading.

Explore Binary.com for versatile trading options including binary trades. Learn about account types, India-friendly access, regulations, and responsible investing tips 📈💡.

Learn how fixed time trading works, with practical tips, risks, and strategies for Indian traders📈. Discover how it compares with other trading styles to match your goals.
Based on 11 reviews